Mint has been reimagined on Credit Karma.
Mint has been reimagined on
Credit Karma.
Reviewing transactions, monitoring your spending and tracking your net worth now have a new home.
Check it out

Popular Mint features have made the leap to Credit Karma
to help you grow your money.
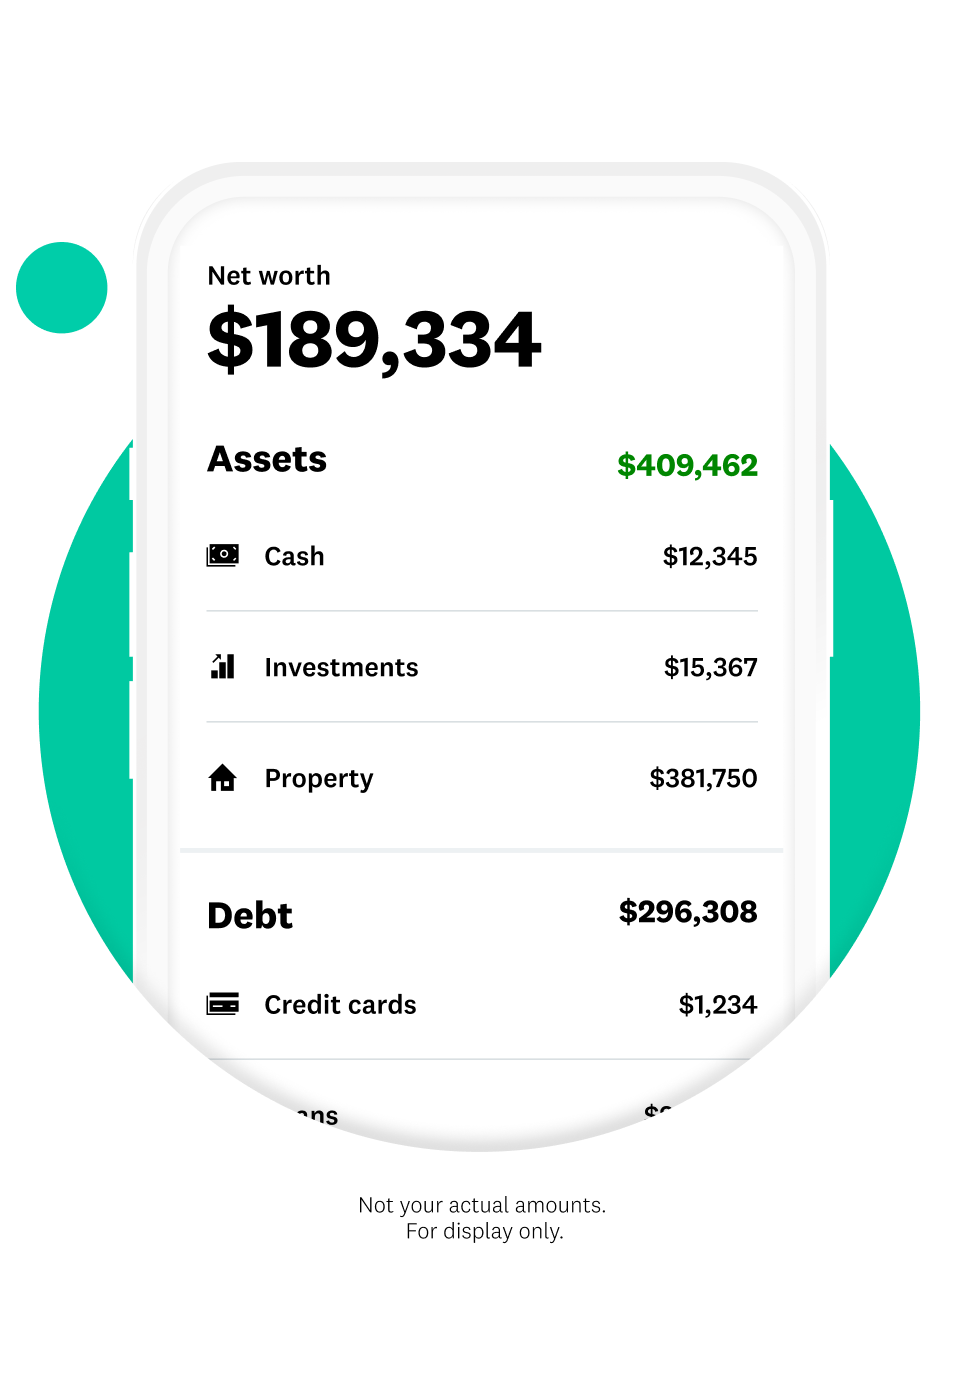
Keep tabs on your
money in one place.
Link your accounts from more than 17,000
financial institutions and view your connected
transactions across them in
one place.
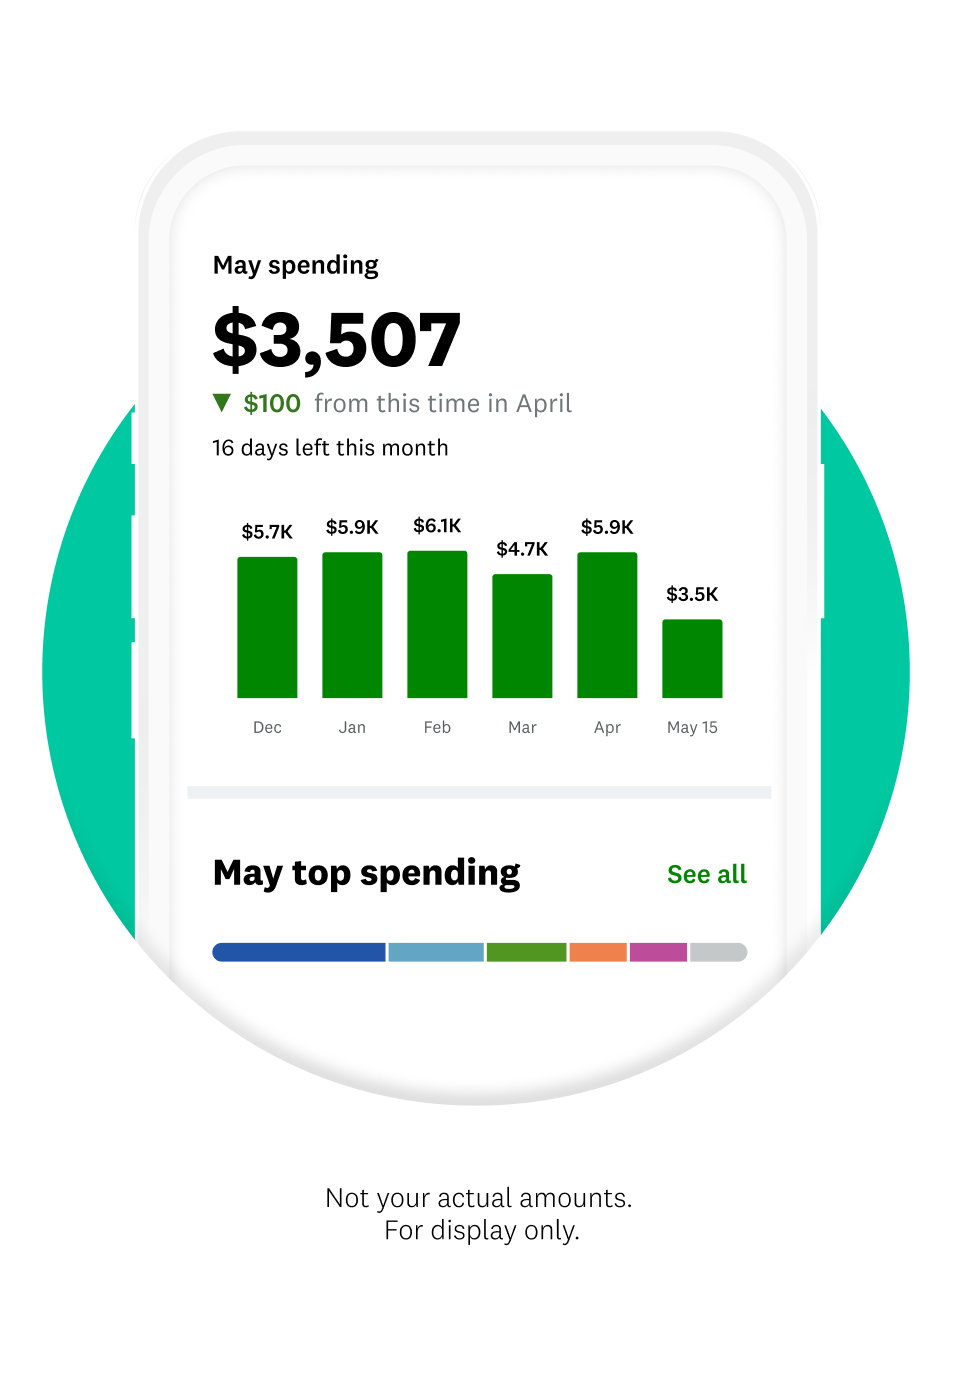
Track your monthly spending and more.
Review your transactions, track your spending by category and receive monthly insights that help you better understand your money habits.